BLOG
Learn how to effectively debug Cordova applications with essential tools, techniques, and best practices to enhance performance and security.
.png)
BLOG
Mobile applications are predominantly written in Java and Swift/Objective-C for android and iOS respectively. There are already a lot of resources on how to setup a pentesting environment, perform assessment for such applications. Same techniques might not work for applications written in Cordova or NodeJS since the apps rely on HTML, JS and CSS instead of using the native APIs in iOS or Android.
Let us consider an example, where an android application written in Java, encrypts the request and response body of the network traffic. Typically, application should be using native libraries to transform the request and response,
private byte encryptAES(byte[] password, byte[] IV)
{
  SecretKey key = new SecretKeySpec(DatatypeConverter.parseHexBinary(keyprovider.getKeyHex()), "AES");
  IvParameterSpec IVSpec = new IvParameterSpec(IV);
  ..
}
To get the key and IV in this case is trivial, by hooking into the function and printing the values of the key and IVSpec, we can find the encryption variables by using Frida or tools like brida, inspeckage.
Our problem now is, what if the same application is written in Cordova? We cannot use the same method because the code responsible to encrypt/decrypt is going to reside in one of the JS file.
We won’t be going in-depth, just enough to understand how to make the application debuggable. As mentioned earlier, Cordova applications are written in HTML and JS. All the assets such as scripts, images, CSS are present in the assets/ folder of the package. When installed, the application uses the device’s in-built WebView to fetch resources, make communicate to the backend server.
When testing web applications, a lot of people have used the browser’s developer tools such as console, debugger and so on. Is there a way to use the same since the Cordova applications also uses WebView which uses browser in some way? Yes, it is possible.
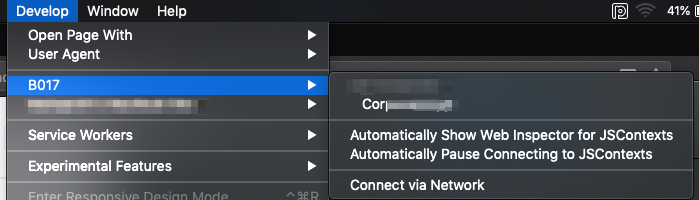
iOS devices come pre-built with Safari browser which uses Webkit, responsible for rendering the resources. To enable debugging on iOS,
Once we select the application show in the menu, the Safari browser will open up the developer options and we can access debugger, network logs and other such tools.
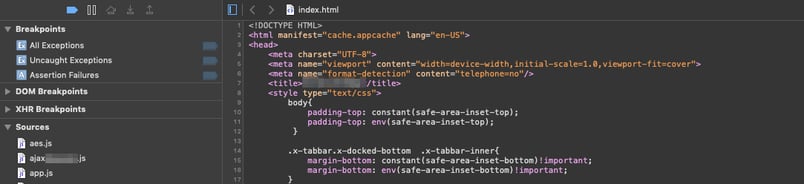
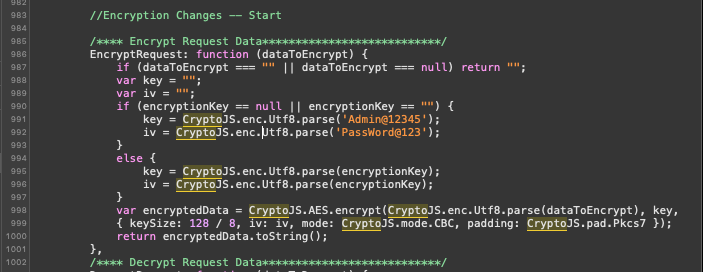
Now, we can analyze the files and can find the key and algorithm which is responsible for encrypting and decrypting requests and responses, which cannot be found by hooking into the functions dynamically.
Android is little tricky since there is no straightforward way to enable the debugging like iOS. There is a prerequisite though, that the Android application’s debuggable flag should be set to true from the manifest.xml. So, we have an option to reverse-engineer the application using apktool, change the flag and recompile. This won’t work on applications which have tamper protection, since we will have to find the logic for the protection and change it again which might be tedious.
Like discussed in the first half of the blog, since the device is going to use WebView, we can find the method which is responsible for enabling the debugging method for the WebView objects and go ahead from there.
From the documentation, we can see that the method setWebContentsDebuggingEnabled is accountable for debugging web contents and is default set to false. We will have to hook into the method dynamically and change the value to true even if it is set to false for all the objects of WebView.
Java.perform(function() {
    var Webview = Java.use("android.webkit.WebView")
    Webview.loadUrl.overload("java.lang.String").implementation = function(url) {
        console.log("\n[+]Loading URL from", url);
        console.log("[+]Setting the value of setWebContentsDebuggingEnabled() to TRUE");
        this.setWebContentsDebuggingEnabled(true);
        this.loadUrl.overload("java.lang.String").call(this, url);
    }
});
Above Frida script enables the debugging of the WebView dynamically. We are hooking into android.webkit.WebView and creating an object setWebContentsDebuggingEnabled always set to true and when we run this script with -f option of Frida, it will automatically enable the debugging when the WebView instance is being called.
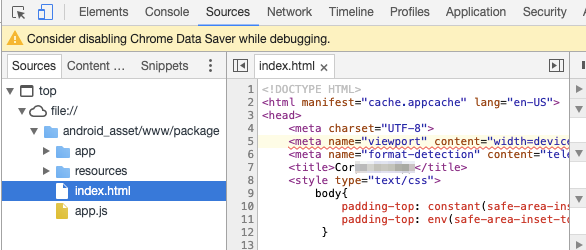
After this, we can go to chrome://inspect and select the application to be debugged. We will be presented with Chrome’s developer tools which we can use to debug the JS further.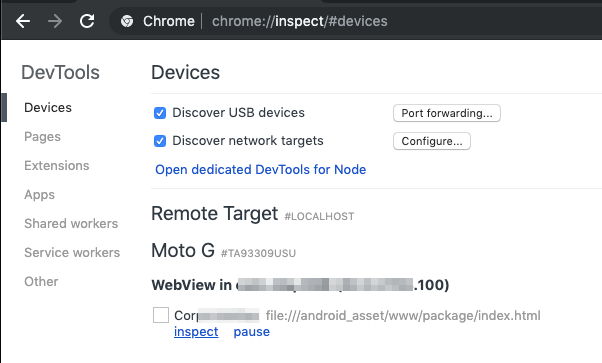
This concludes the post about debugging Cordova applications. Furthermore, we will be discussing other applications such as ones written in NodeJS, Xamarin, and so on. You can visit Appknox & explore our mobile app security related products which can make your mobile app safe & secure.
References :
[1] Developer.android
[2] Cordova.apache
Hackers never rest. Neither should your security!
Stay ahead of emerging threats, vulnerabilities, and best practices in mobile app security—delivered straight to your inbox.
![]() Exclusive insights. Zero fluff. Absolute security.
Exclusive insights. Zero fluff. Absolute security.
![]() Join the Appknox Security Insider Newsletter!
Join the Appknox Security Insider Newsletter!

